CF-Seq User Guide
Table of Contents
1. Why Use CF-Seq?
2. How CF-Seq Works
3. Citing CF-Seq
4. Feedback and Questions
5. Launch the App
Why Use CF-Seq?
Note: Short on time? Scroll down to the end of the user manual to launch the app
The CF-Seq application was launched with a central goal in mind: to illuminate the landscape of prior published research on CF pathogens. Our aim is to take the motley collection of individual RNA-seq datasets stored in the Gene Expression Omnibus (GEO) – the go-to database for transcriptomics experiments – and show how they are connected. With this approach, we hope to make it more possible for any CF researcher to build on prior findings and generate new experimental hypotheses.
With CF-Seq, you can identify how different bacterial strains, media, treatments, and gene perturbations have been employed across experiments on 13 CF pathogens. After choosing a study of interest, you can explore how each gene has been affected by the conditions of the experiment. And if there are multiple conditions – say multiple antibiotics, growth conditions, or media tested – for a single experiment, you can explore the effects of each condition independently. For many studies, you can also see how the genes on various biological pathways are up or downregulated to get a global picture of bacterial response to any given experiment. All of this can be done with zero computational experience!
CF-Seq currently includes a set of more than 120 CF pathogen studies. Over time we will expand not only the number of studies we include in the app, but the species we include (more CF pathogens and CF studies involving human cells and other model organism).
How CF-Seq Works
Before you start using CF-Seq, make sure to read through the basic instructions below so you understand how to use it most effectively.
[Viewing and Filtering Studies]

Once you press the ‘Launch App’ button below, you will be transported to the ‘Study View’ panel of the app. This is where you can select a species and view all of its studies. Simply select your species of interest in the ‘Select a Species’ drop-down menu
Once you select a species, all of the studies for that CF pathogen will appear at the bottom of the screen. At this point, you can click the blue button next to any study, view more detailed metadata, and run analysis.
But if you would like to filter available studies by experimental characteristics first, you can adjust any of the drop-down menus at the right-hand side of the app window. Once you finalize selections, you will see just those studies that meet your filtering criteria. At this point, you can change the filters, or click the blue button and run analysis on a study of interest
[Viewing Study Analysis]
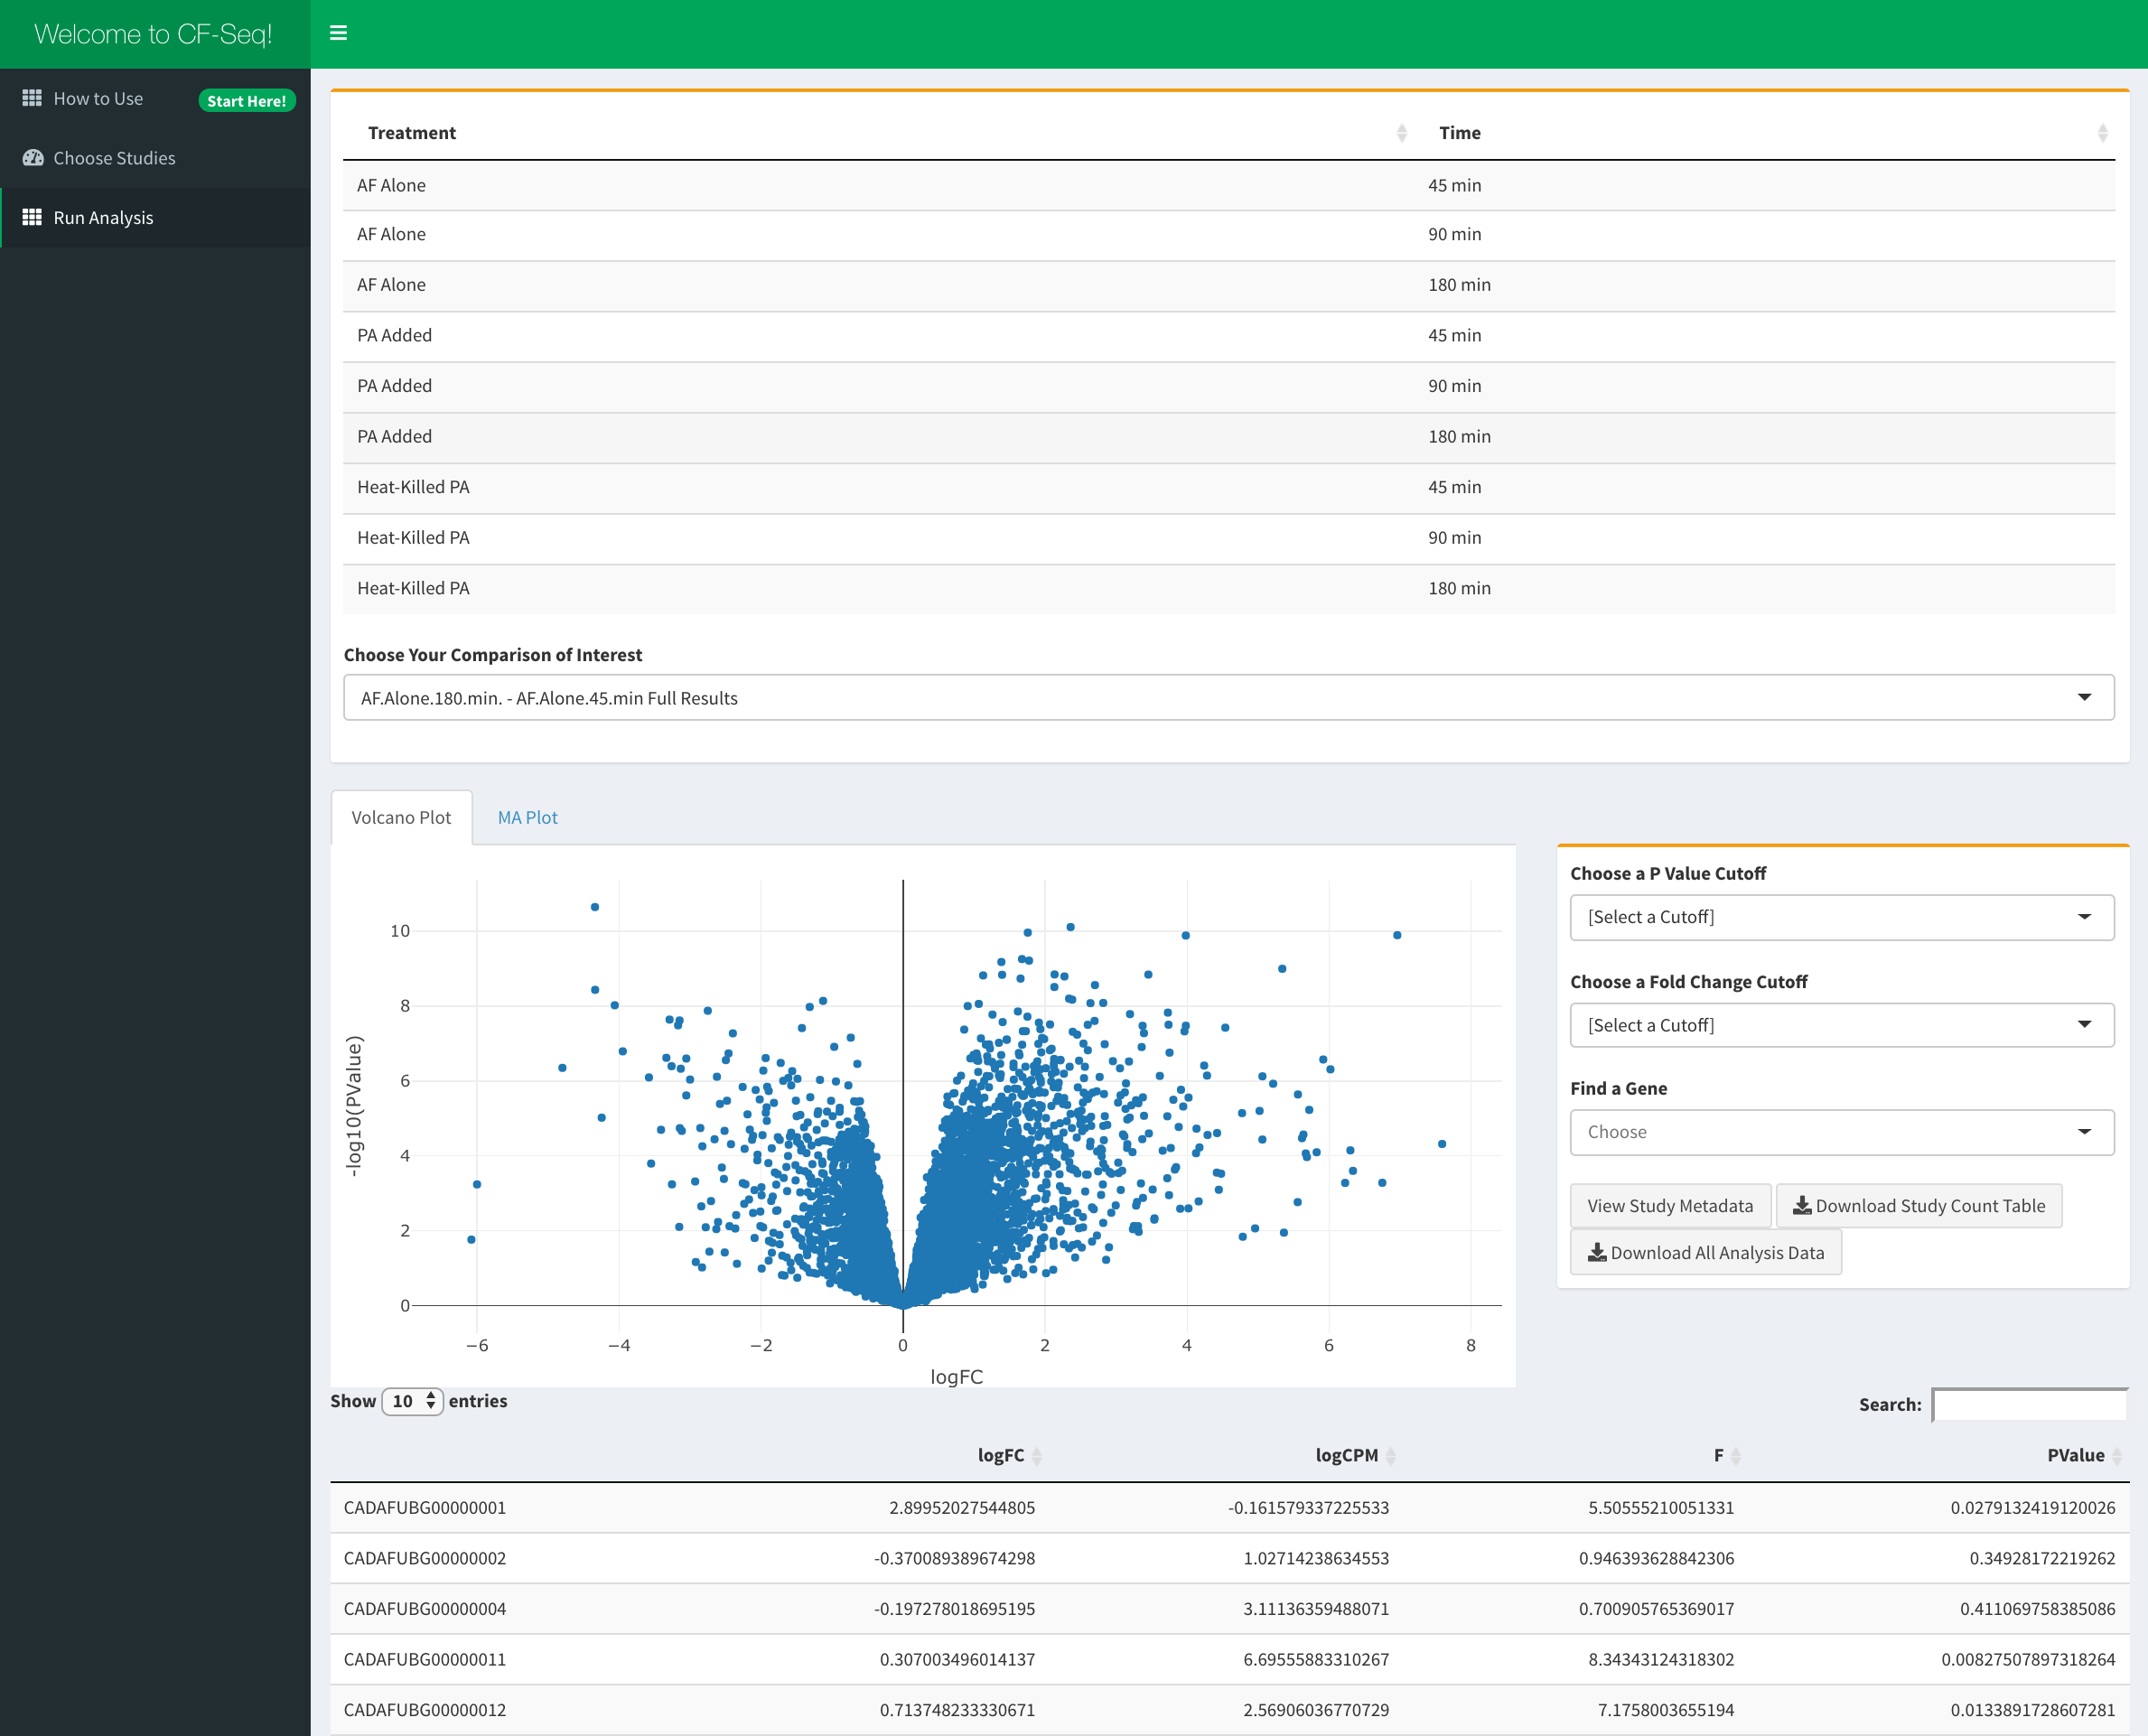
After pressing the run analysis button for any given study, you will be transported to the ‘Study Analysis’ window of the application. Here, you can see all of the experimental conditions that the CF pathogen was subjected to in the selected study, and pick two for which to compare gene expression and view differential expression analysis results. When you select your chosen comparison, and finalize that selection, you will be presented with a volcano plot and MA plot which show how the expression of each gene different between conditions (whether expression went up or down) and by how much. Furthermore, you will see a table of analysis with the P values, fold changes, and other metrics for each gene.
Once a comparison is shown, you also have the option to highlight individual genes, genes that surpass a chosen statistical significance (P Value) or fold change, and for some studies, genes associated with biological features like KEGG pathways and GO terms. Any of the plots and tables that you generate by filtering the data can be downloaded exactly as shown in the application (With any selected genes highlighted), as can the original study count table if you’d like to perform computational analysis yourself. When finished performing analysis for a particular study, you are welcome to check out another by pressing the ‘reset analysis’ button at the bottom of the ‘Study Analysis’ panel to be taken back to ‘Study View’ panel
Citing CF-Seq
If you make use of the CF-Seq application to further your own experimental efforts any way – to explore prior findings, generate new hypotheses, or as inspiration for future data analysis applications, we kindly ask that you cite our associated paper:
Click here to view the CF-Seq publicationFeedback and Questions
If you have any questions about the application, or would like to report a bug, please contact me at the following address:
neff [dot] sam1 [at] gmail [dot] com
Launch the App
Thanks for reading! Now go ahead and press the button below to start the application:
PS: If the green button doesn't do anything right away, the app is still loading data. It should be ready in less than 30 seconds
1. Choose your species
2. Choose your study filters
Select from any of the conditions above to refine your search.
Study design does not allow for differential expression analysis:
              either there is only 1 replicate per condition or conditions have an unequal number of replicates.
              The study count table is still available to download if you wish to check it out for yourself
*Interpret comparison, [Comparison A] - [Comparison B], as follows: [Selected Gene] is upregulated/downregulated in [Comparison A] vs. [Comparison B]
In other words, if [Selected Gene] has a fold change greater than zero, [Selected Gene] is upregulated in [Comparison A] vs. [Comparison B]
If [Selected Gene] has a fold change less than zero, [Selected Gene] is downregulated in [Comparison A] vs. [Comparison B]